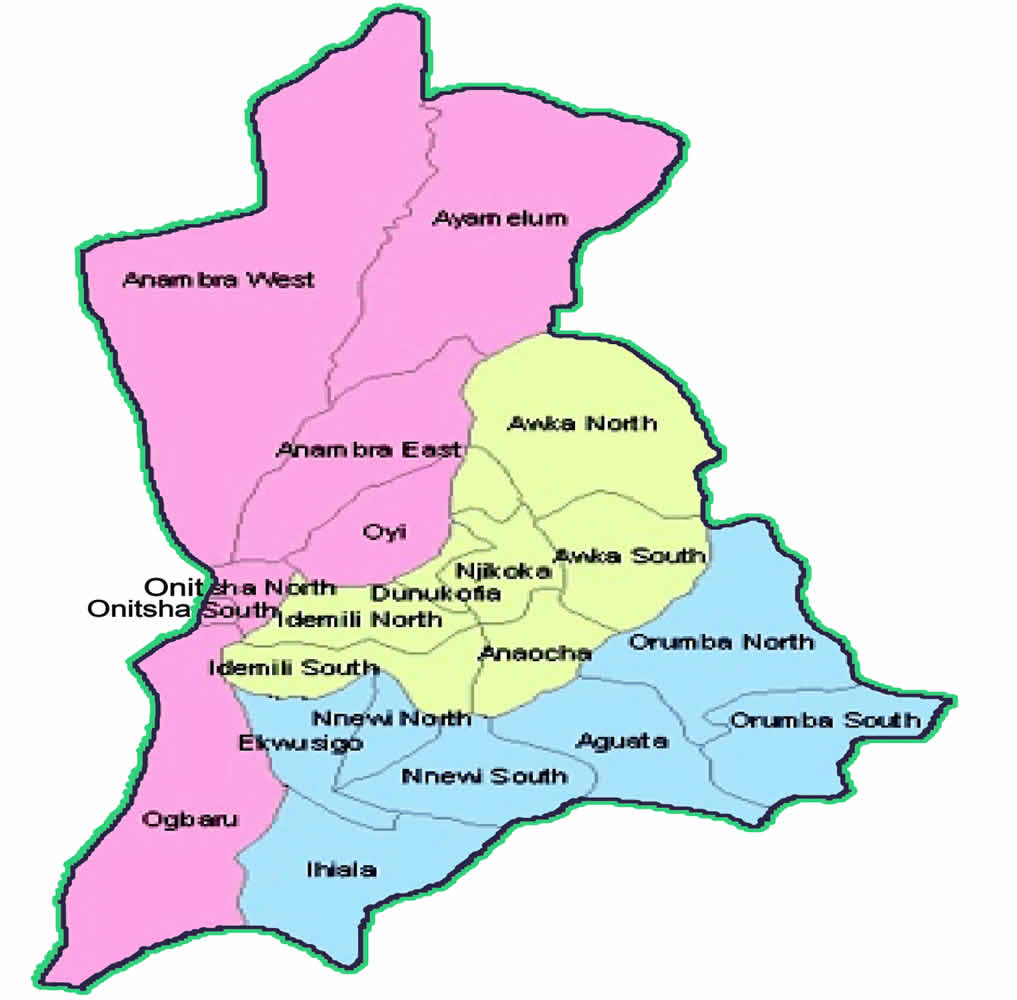
Map of Anambra State
Brief on Anambra State
Anambra State is in the Southeast geo-political zone of Nigeria, with Awka as the state capital. The present Anambra State was created in August 1991 from the old one that was created in 1976, when the then East-Central State was divided into Anambra and Imo States.
Anambra State shares boundaries with Kogi State to the North; Enugu State to the East; Imo, Abia and Rivers states to the South; and Delta and Edo States to the West.
The state has a land area of 4,416 sq.km. The state’s population from the 2006 Census data was 4,182,032. There are twenty-one (21) Local Government Areas (LGAs) in the state. Besides Awka, the state capital, major towns in the state are Onitsha, Nnewi, Obosi, Awkuzu, Umuleri, Aguata, Ojoto, Ihiala, Abagana, Nkpor, Okija and Aguleri.
Electoral Statistics
The Independent National Electoral Commission (INEC) has scheduled the Anambra State Governorship Election to hold on November 16, 2013; and painstaking arrangements are being made to ensure smooth and successful conduct of the poll across the state (i.e., in all the LGAs).
The following are relevant electoral statistics for the state:
- Ø No. of Local Government Areas – 21
- Ø No. of Registration Areas (i.e., Wards) – 326
- Ø No. of Polling Units – 4, 608
- Ø No. of Registered Voters (post August 2013 CVR) – 1, 784, 536
Breakdown of Voter Population, Polling Units and Voting Points
| S/N | LGA | Wards | Registered Voters | No. of PUs | Voting Points |
| 1. | Aguata | 20 | 101, 974 | 300 | 381 |
| 2. | Ayamelum | 11 | 55, 936 | 173 | 199 |
| 3. | Anambra East | 15 | 61, 178 | 200 | 243 |
| 4. | Anambra West | 10 | 43, 172 | 158 | 173 |
| 5. | Anaocha | 19 | 76, 812 | 310 | 333 |
| 6. | Awka North | 14 | 44, 159 | 130 | 163 |
| 7. | Awka South | 20 | 118, 312 | 255 | 414 |
| 8. | Dunukofia | 14 | 45, 289 | 146 | 176 |
| 9. | Ekwusigo | 12 | 62, 318 | 175 | 222 |
| 10. | Idemili North | 12 | 173, 832 | 306 | 592 |
| 11. | Idemili South | 12 | 85, 731 | 200 | 309 |
| 12. | Ihiala | 20 | 113, 783 | 278 | 402 |
| 13. | Njikoka | 18 | 70, 415 | 201 | 252 |
| 14. | Nnewi North | 10 | 112, 121 | 198 | 388 |
| 15. | Nnewi South | 20 | 57, 069 | 295 | 300 |
| 16. | Ogbaru | 16 | 139, 057 | 293 | 491 |
| 17. | Onitsha North | 15 | 117, 332 | 201 | 386 |
| 18. | Onitsha South | 17 | 123, 466 | 200 | 417 |
| 19. | Orumba North | 18 | 61, 321 | 231 | 267 |
| 20. | Orumba South | 18 | 46, 100 | 192 | 211 |
| 21. | Oyi | 15 | 75, 159 | 166 | 262 |
| Totals | 326 | 1, 784, 536 | 4, 608 | 6, 581 |
Gender Distribution of Voter Population
- Ø Females – 900,701 (50.5%)
- Ø Males – 883,835 (49.5%)


My hunch tells me that a complete repeat of voting in Anambra may not reveal any significantly different voter trend than what was seen in the November 16 voting with its lapses.
This is a very personal view though.
Repeat this election and APC (Ngige)at still win in Idemili North, and Idemili South, his LGA. This zone benefitted specially in roads development during his former stay as governor. He turned Alor his hometown into ‘Alor London’.
APGA may end up still winning in the 16 LGAs while LP may retain Nnewi North, Uba’s homestead.
Should INEC spend huge resources doing a complete election rather than supplementary election as planned?
Excellent post. I was checking constantly
this weblog and I’m impressed! Very helpful information specially the last section 🙂 I take care of such information much.
I was looking for this particular info for a long time.
Thanks and best of luck.